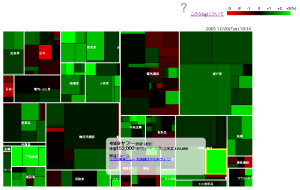
日経 225 銘柄の株価の様子を視覚化した 日経平均 225 銘柄のマップ
2005-12-17-1: [Visualization]
http://n225.jp/

視覚化手法は Shneiderman の Treemap ですね.
- Treemap
http://www.cs.umd.edu/hcil/treemap/index.shtml
- ref.: Survey : Information Visualization
http://iv.xight.org/
- via: Going My Way
http://kengo.preston-net.com/archives/002356.shtml


